
Understanding the Value of Social Interaction: The Social Intelligence Dashboard
February 14, 2019

For the Learning Pool Platform, Social Learning and Social Interaction has always remained a core function of the online learning platform.
But over the last few months, we’ve been quietly researching methods to take the social elements of Learning Pool Platform, along with social interactions from other tools on the market, to effectively analyze the learning value that is generated from these experiences.
Finally, we had a breakthrough following our work with text analysis, leading to the birth of the Social Intelligence Dashboard – SID for short! Full disclosure – we’re pretty excited about this, and so far everyone we have shown it to has shared a similar level of enthusiasm.
Introducing the Social Intelligence Dashboard
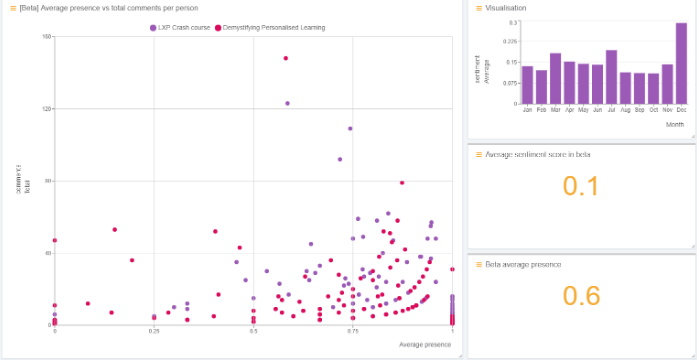
In a nutshell, SID is a series of different visualizations that take the results of the classification of comments to show whether they are considered passive or engaged, as well as an overall score for the sentiment of the comment.
We have created two methods to make this data available:
- To attach additional metadata to an xAPI statement after the score is applied by our Machine Learning Engine and displayed in Learning Pool Learning Record Store (as you can see below)
- Is the Social Intelligence Dashboard itself which will be a feature of Learning Platform
Some of you will have seen a demo at our recent launch of the new Learning Pool Platform, but for those who haven’t here is a sneak peak of the prototype version:
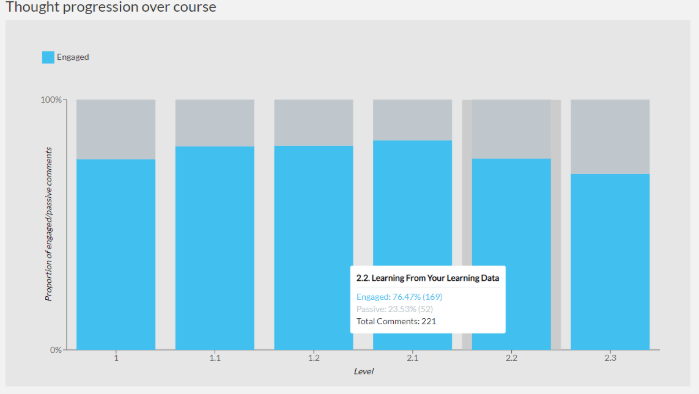
Figure 2: Graph showing through progression across different levels of a course
Solving Problems with the Social Intelligence Dashboard
Seemingly, for every question I come up with that can be answered using comment analysis, someone else comes along with yet another problem that be solved through the use of this tool.
The list is endless and continues to grow as everyone’s understanding of it becomes more refined. I won’t bore you with that list just yet, but I have put together a few things SID can help you better determine which we have found particularly interesting as a result of our experiments:
- Is the course enjoyable and does it promote behavioral change within the group? Does this content meet the expected standard of the target group?
- Which elements of the course content are easy to understand and what are effective methods to encourage users to demonstrate this understanding?
- Do your learners actually learn?! I don’t mean simply passing a test – I’m talking about demonstrating critical thinking around the subject matter and observing how this develops as the course goes on.
- Is the course of the correct length? Being able to see where learners interest and overall motivation drops off is a great indicator of where to add in breaks or even trim down the content.
How Does the Social Intelligence Dashboard Work?
SID uses advanced statistical techniques powered by a combination of deep learning recurrent neural net algorithms to label comments according to a predefined model of ‘what good looks like’ – in other words, AI.
Our models are either generic, built as a result of our research and own training date (built up over thousands of previous comments and conversations), or can be tailored to an organizations requirements, for example, to look for a specific sort of interaction.
Our standard proprietary model can rank user comments in terms of their value as perceived by the Community of Inquiry Framework. As we see more comments and conversations, our model gets stronger, learning from the breadth and depth of conversation that occurs within the Learning Pool Platform.
How Can I Get SID?
SID will be available with all Learning Pool Platform licenses, built directly into the platform. Currently, it is also possible to gain access to the dashboard even if you don’t have our learning platform. If you already have access to your own Learning Platform, you can make use of the Machine Learning Engine for the reporting in our Learning Record Store via one of our apps.
If you’d like to learn more about the Social Intelligence Dashboard, you can get in touch to arrange a demo or some time to chat.
Got a learning problem to solve?
Get in touch to discover how we can help