
Learning Pool Learning Record Store xAPI Reports and Exports – Part 1
October 2, 2014
This blog post is the first in a three part series on what we call reports and exports.
Reporting and exporting in Learning Pool Learning Record Store are essential tools for analysing your data, allowing you to move your data between programs and to other LRSs. We think you can find tons of interesting ways to use these features so that’s why I’ll be showing you what they are and how they work..
In this blog I’ll be talking about reports. These have been a feature of Learning Pool LRS
for some time. Reports allow you to filter statements that were sent to the LRS by a range of criteria; this is useful if you just want to see all the statements for a particular actor, activity, etc. or a combination thereof.
How do I Create a Report in Learning Pool LRS?
So now you might be wondering how you can create one of these mysterious sieves for your statements. I want you to go to Learning Pool LRS in your browser, once you’re there, select your LRS from the LRS List (in the top right). Now I’d like you to select Reports (from the menu on the left). If you’re new to reports, you’ll probably be greeted with a very bare page that looks something like this…
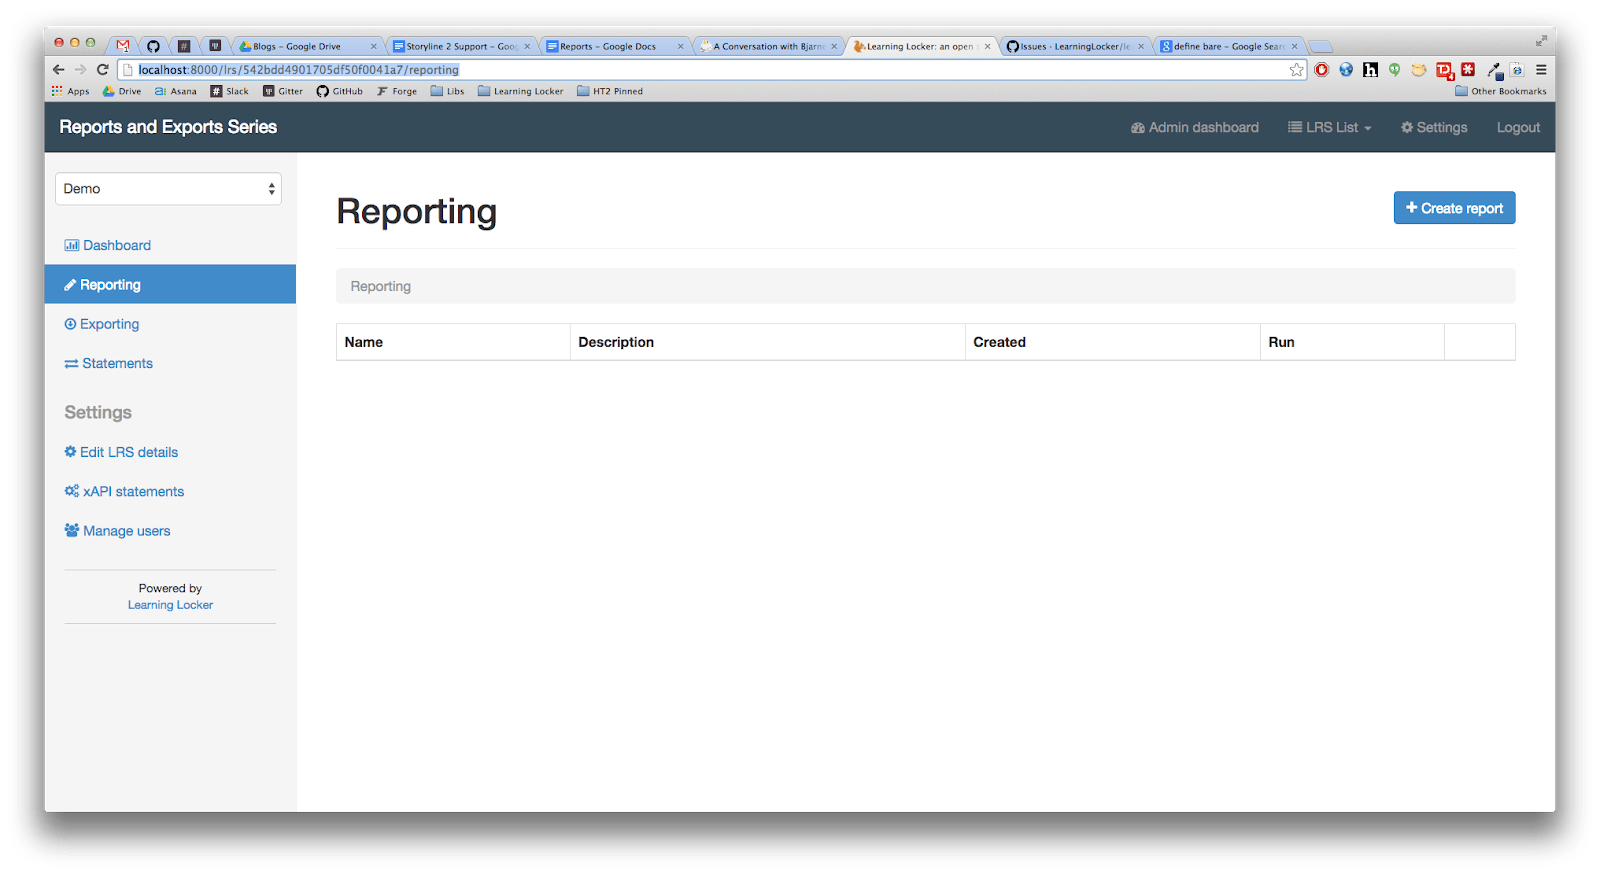
…if that’s the case, don’t worry, I’m going to show you how you can create reports.
See that Create report button in the top right? Click that and we’ll get started with your first report.
Now what?
So if you followed the previous section on creating a report, you’re probably looking at something like this…
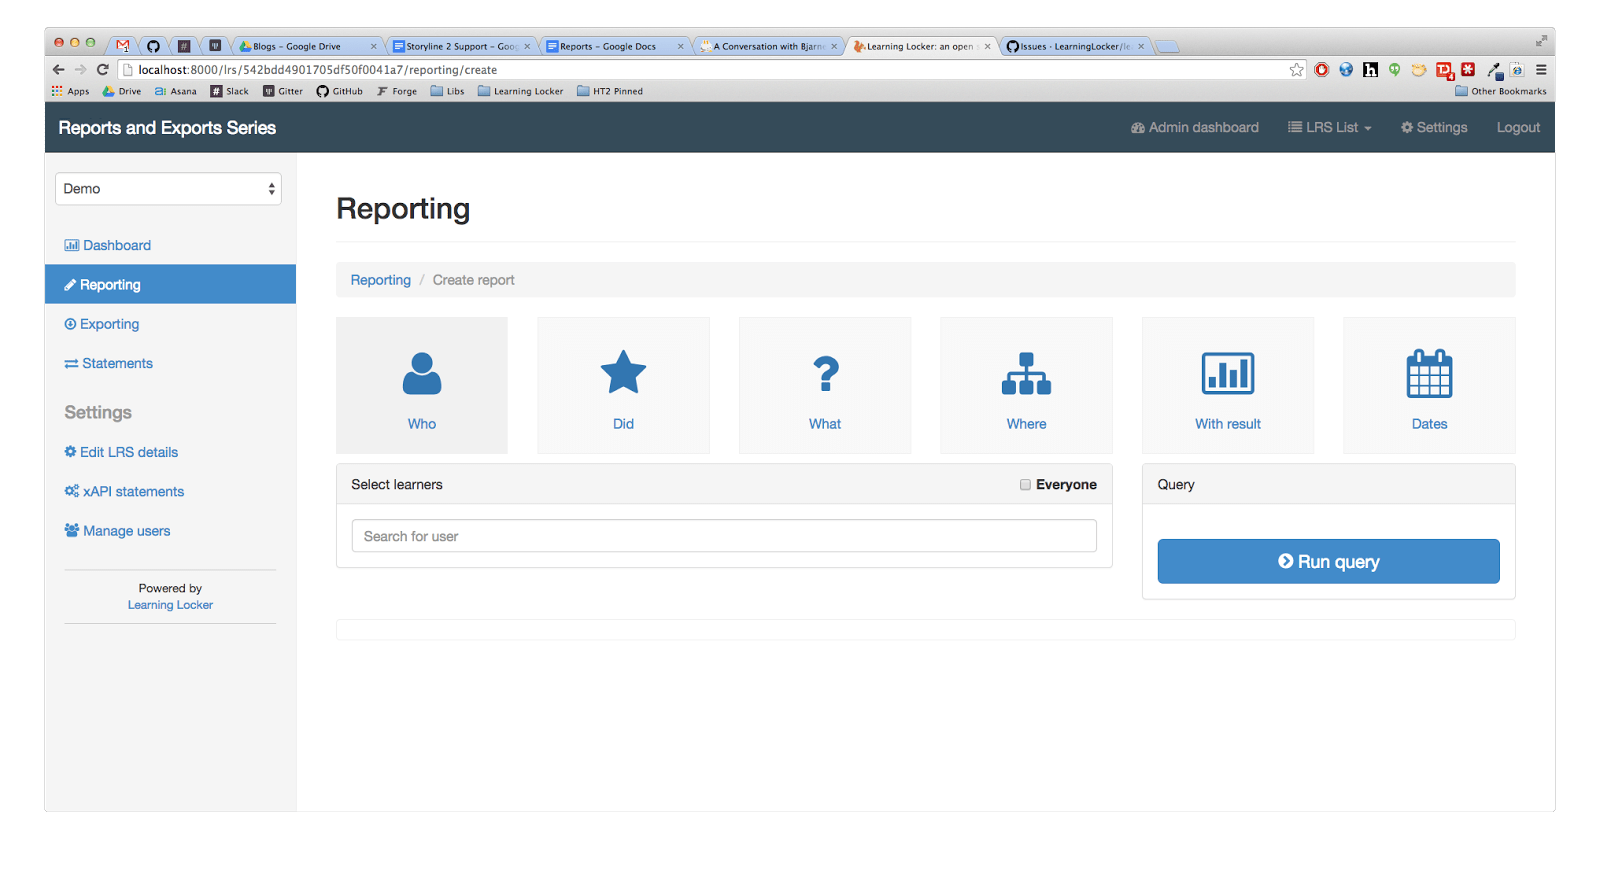
You should notice that there are six large squares (Who, Did, What, Where, With result, Dates), these are called categories. Each of these categories contains many different filters that you can add to your report.
Let me explain them in more detail.
What is the who category?
This category lets you filter actors (people that did activities). If you check the Everyone box, then we won’t leave any actors behind, meaning we won’t filter anyone out. However, you may only want to know what “Joe Bloggs” has been up to, so you could add them as a filter by typing their name where it says Search for user and selecting them from the drop down like so…
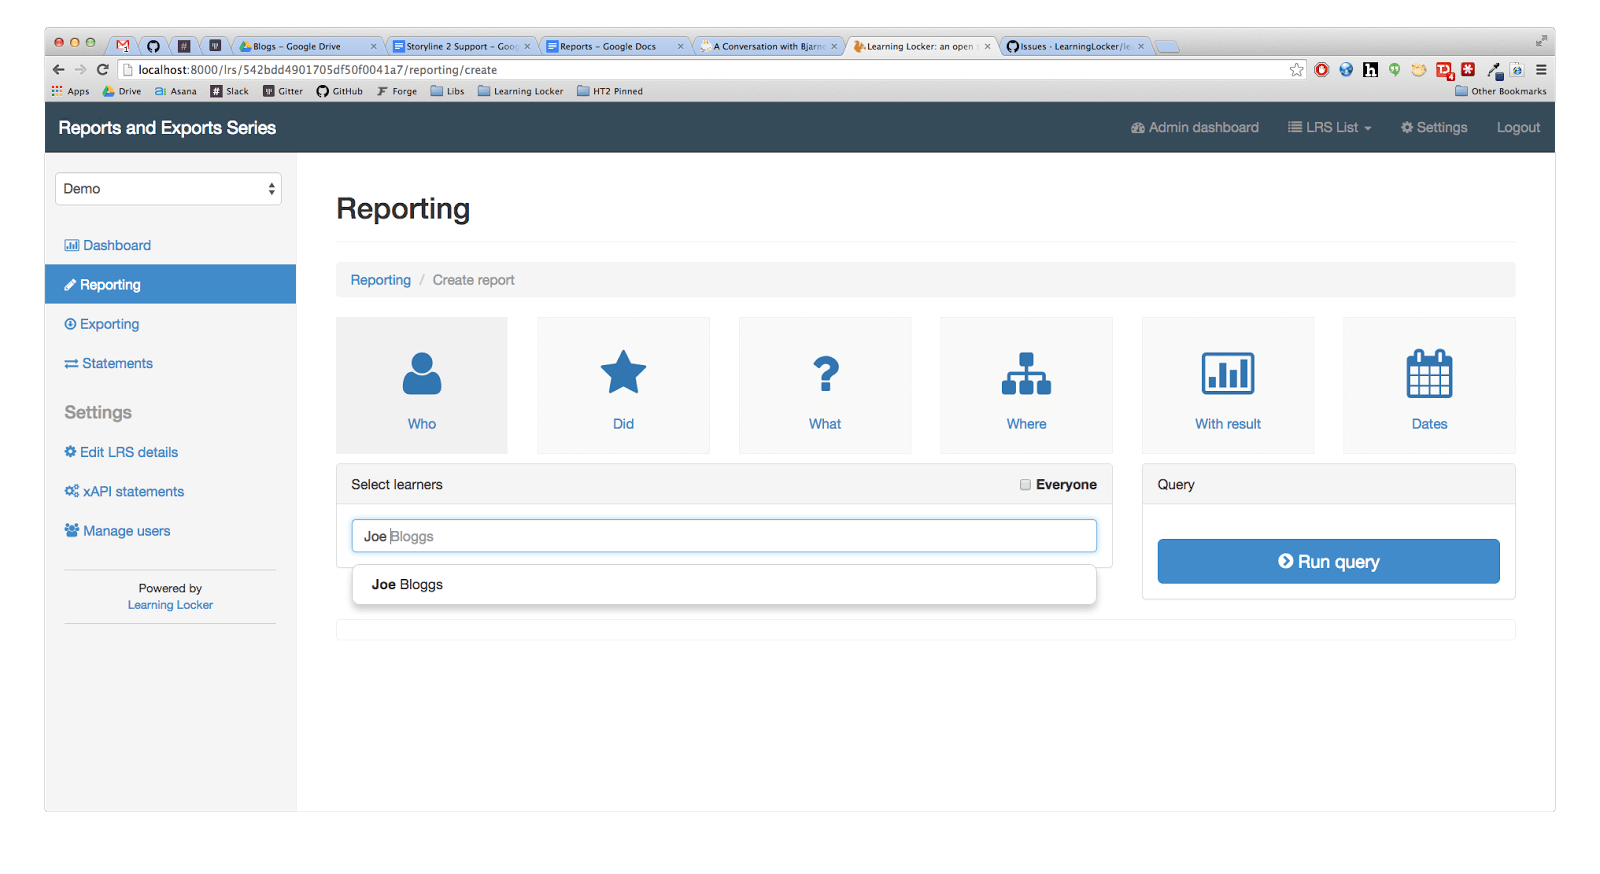 …you can do this as many times as you like to add more actors. If the actor’s name isn’t in the dropdown you probably misspelled their name or they haven’t done anything according to your LRS.
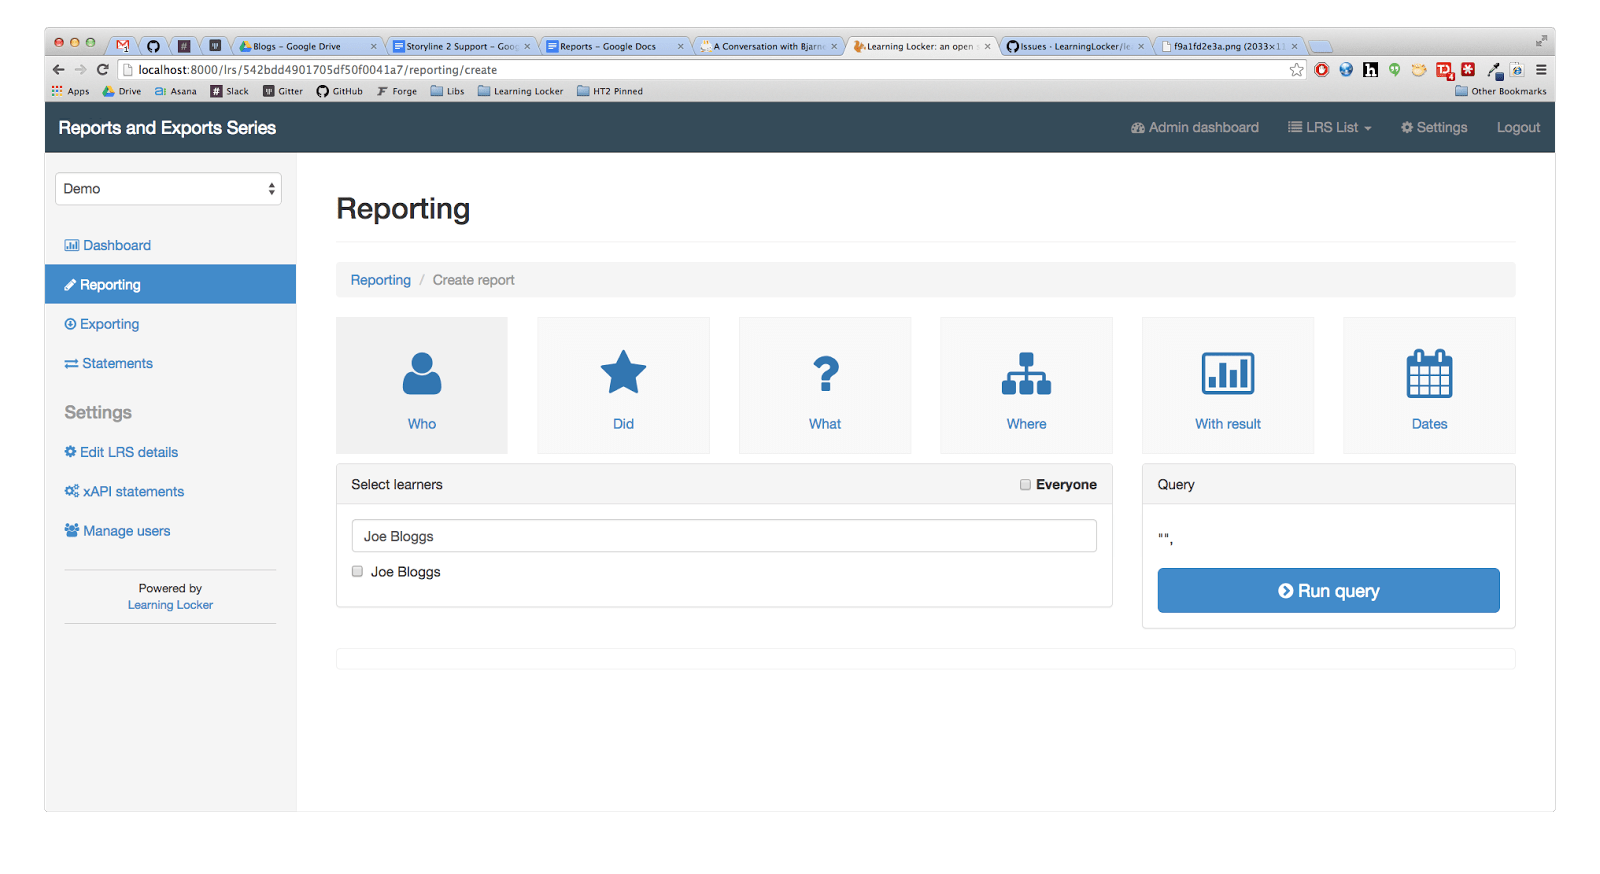
If you decide you no longer want to include one of the actors, you can uncheck them using the checkbox next to their name like so…
What is the did category?
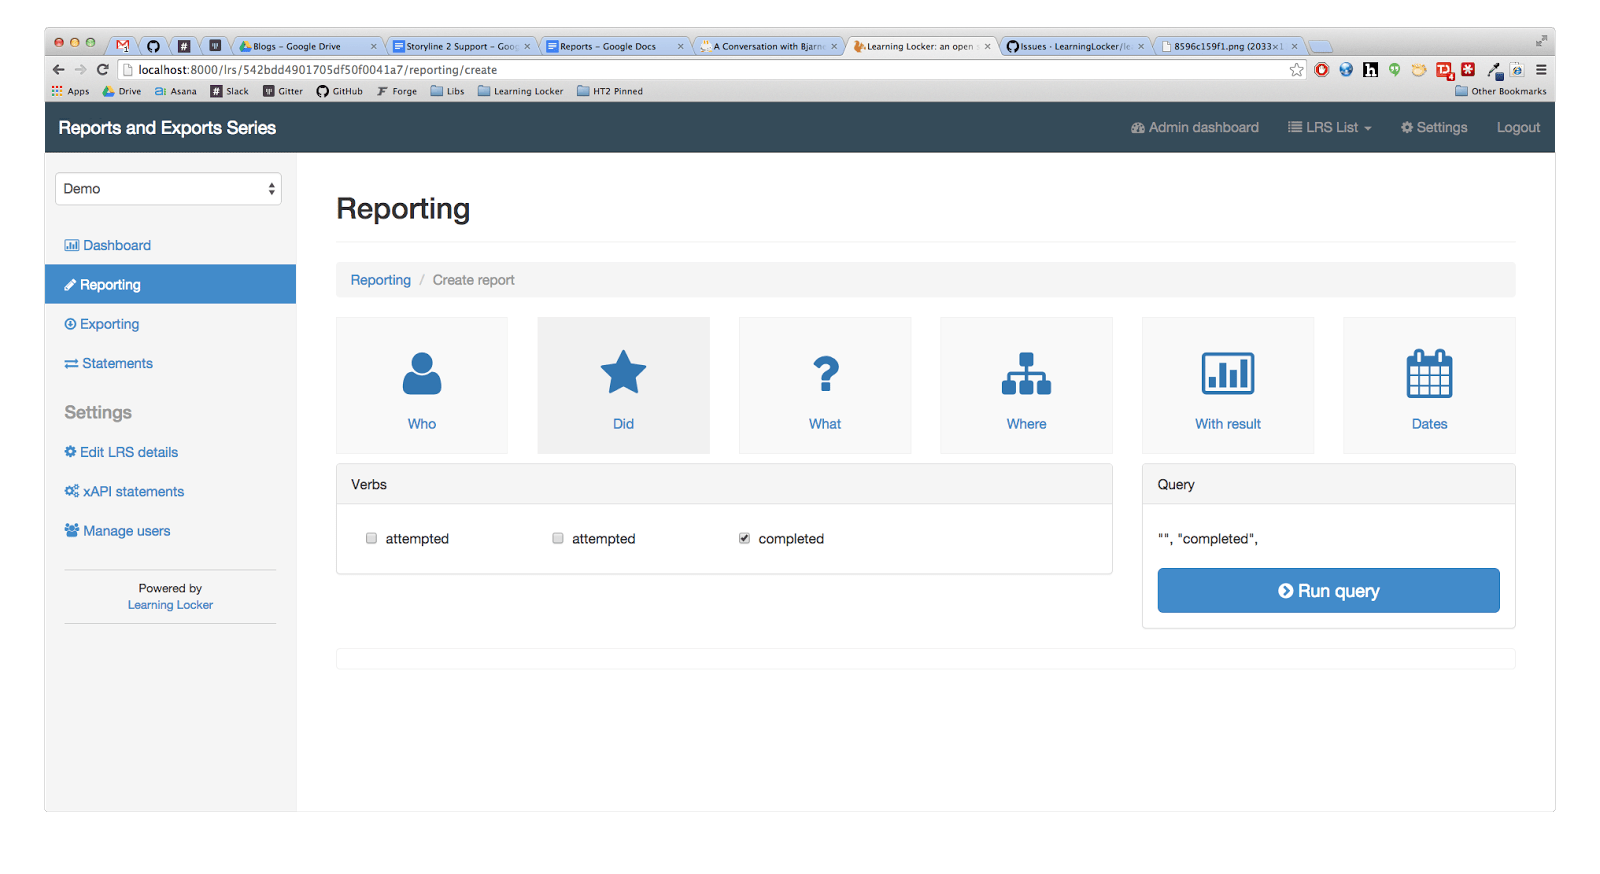
The did category lets you filter by verbs (how they interacted with something, i.e. “completed an activity”). If you click the square that says Did you will see that each verb recorded in the LRS dataset has a checkbox next to it;, toggling this checkbox determines if that verb should be included in your filter. For example if I only wanted to see statements where the verb was completed, I would uncheck all of the other verbs and leave only completed checked like so…
What is the what category?
This category allows you to filter by activities (what people did). You can click the square that says What to add filters in this category. These filters can be added in a similar way to actors in the who category.
You search for an activity’s url, in my case this is “https://example.com/activities/1” as you can see in the screenshot below. The activities can be added and removed in a similar way to actors in the “who” category too.
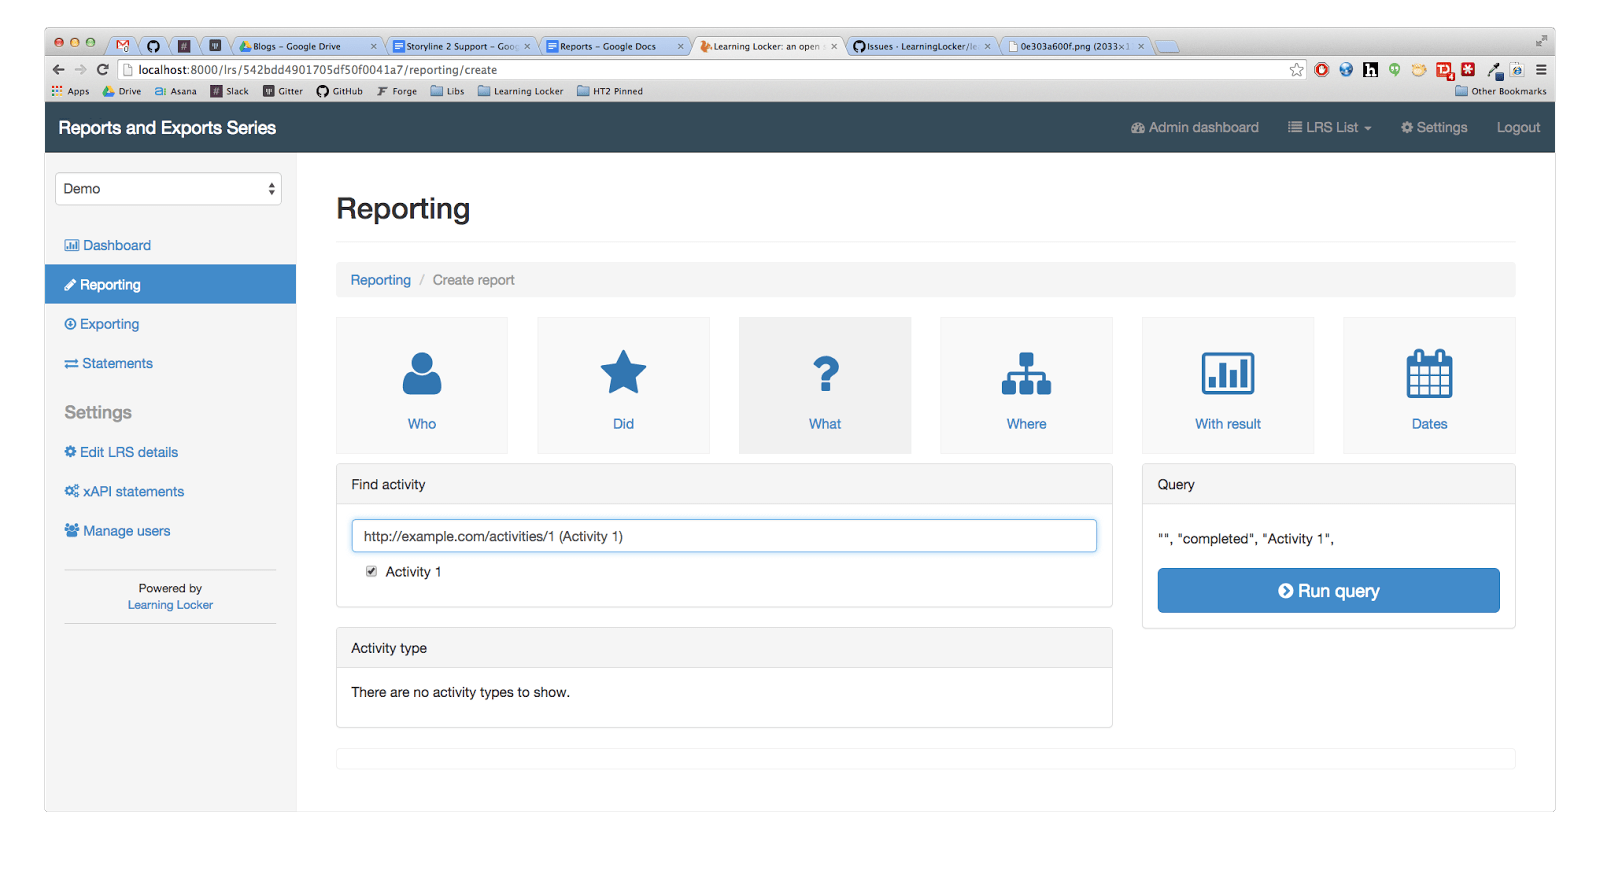
You may also have activity types (as you can see in the screenshot above) which can be added and removed in similar way to verbs in the did category.
What is the where category?
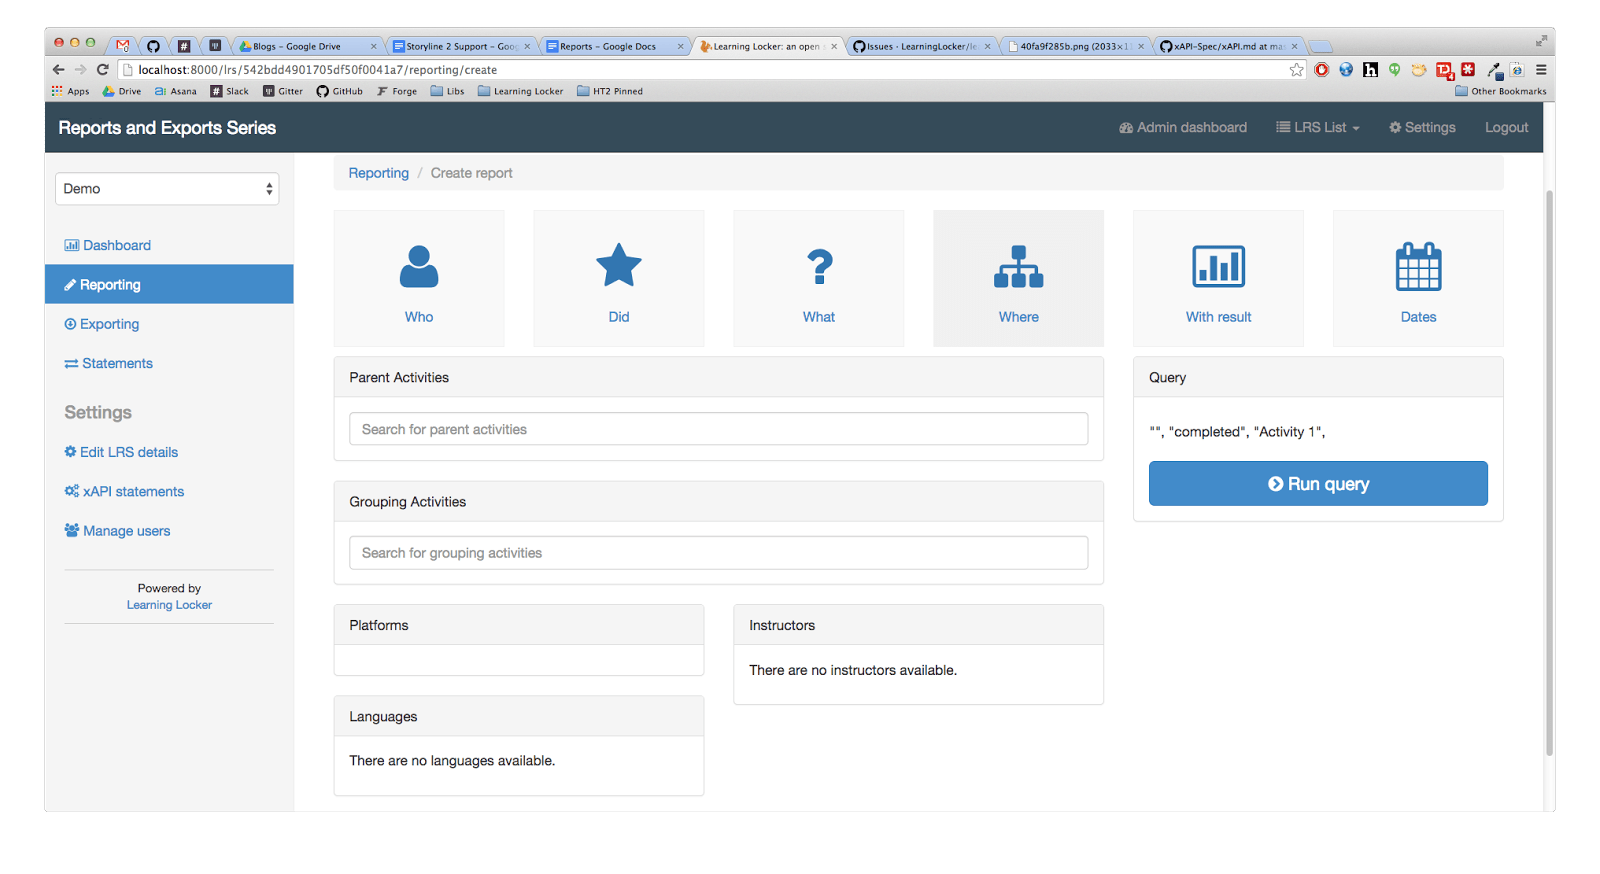
If you click the square that says Where, you’ll be taken to this category in which you can filter in terms of the context that activities took place in. A report allows you to add filters for various contexts, these contexts include Parent Activities, Grouping Activities, Platforms, Instructors, and Languages.
For example, an ‘activity’ could be a question in a group of questions (grouping activity), as part of an exam (parent activity), that is taken in English (language), and answered on ‘my exam’ (platform)”.
What is the with result category?
Where some of our stored data has a result in the context, we can use the With result category.
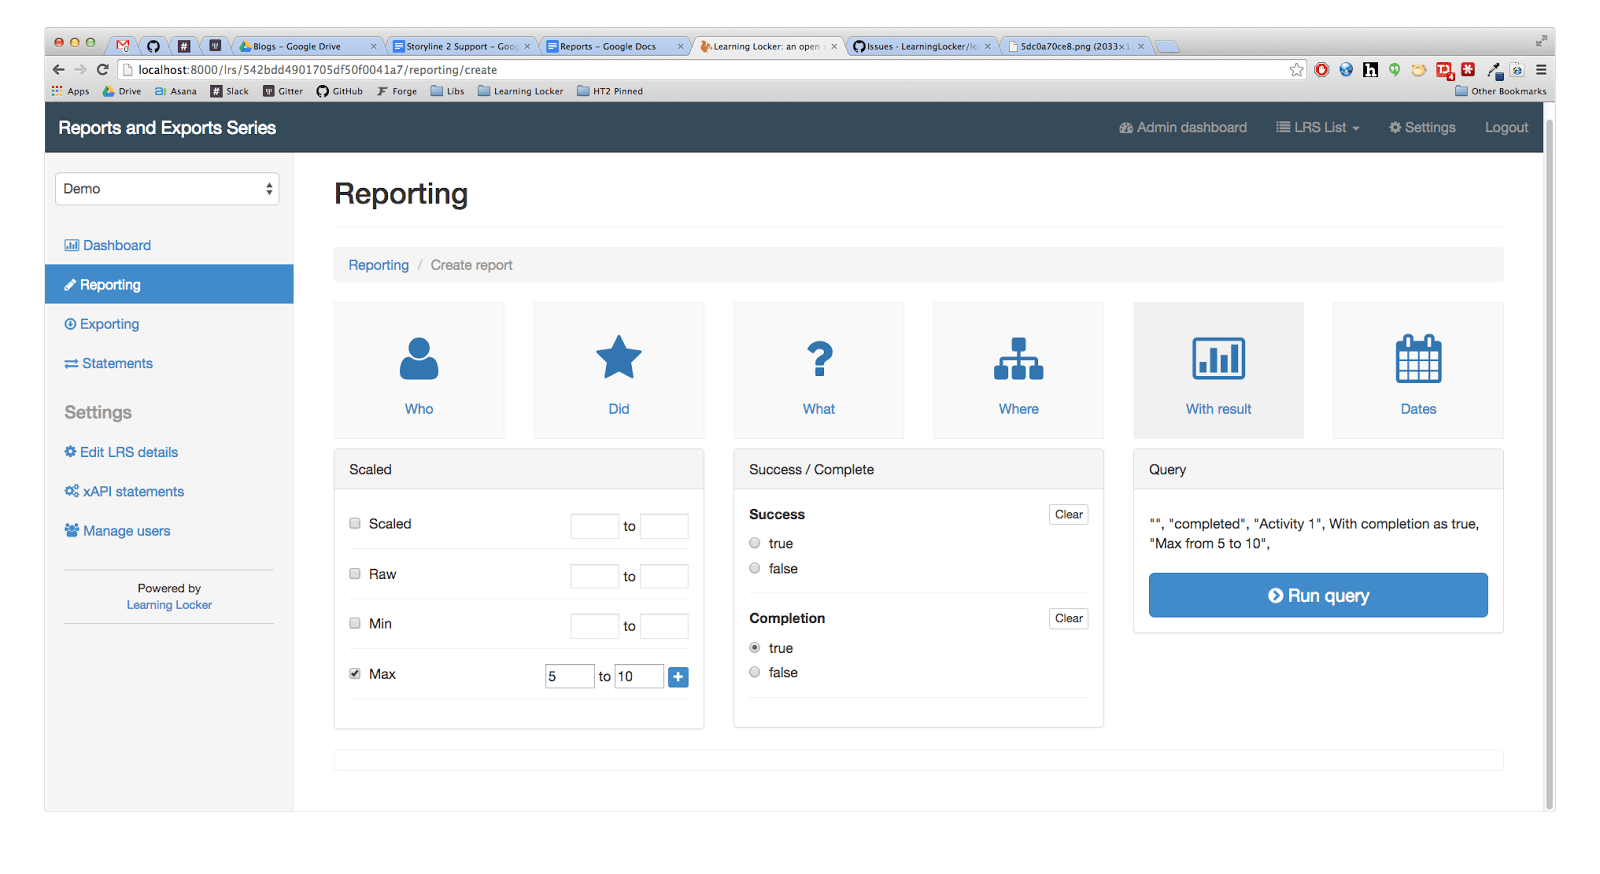
Imagine our previous example: An actor (in this case a learner) answers our question set. This returns a result which may have a maximum (max), minimum (min), raw (the actual mark), and scaled (the percentage of the raw mark in relation to the max) mark. The actor may or may not complete the set (hence completion). They may also be successful passing the question set, if they obtain the necessary score (hence success).
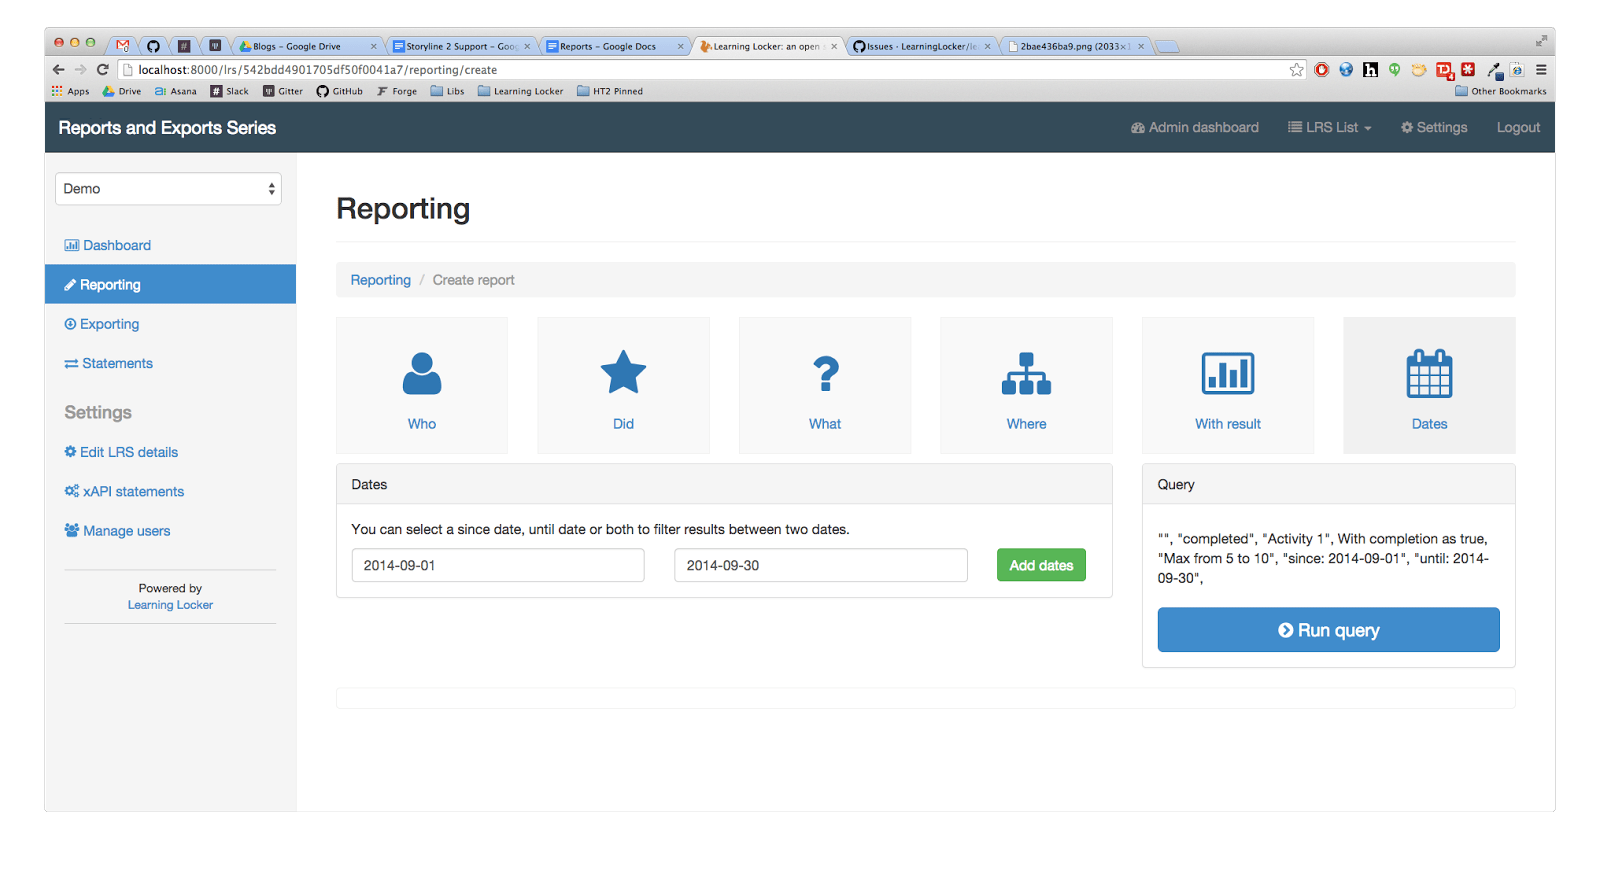
Therefore, this category would allow me to filter all results where the maximum mark was between 5 and 10, and the set was completed (as you can see in my screenshot below).
What is the dates category?
This is the final category which you can add filters to by clicking the square labelled Dates. Here you can set a date range from which you’d like statements to be returned. Statements that were not made during your date range will not be returned (unless it meets certain conditions regarding statement refs). For example I can search for all activities that were made in September 2014 (see below).
What can I do now that I’ve added the filters?
Clicking the Run query button to the right will run your query and display the results of it below like this…
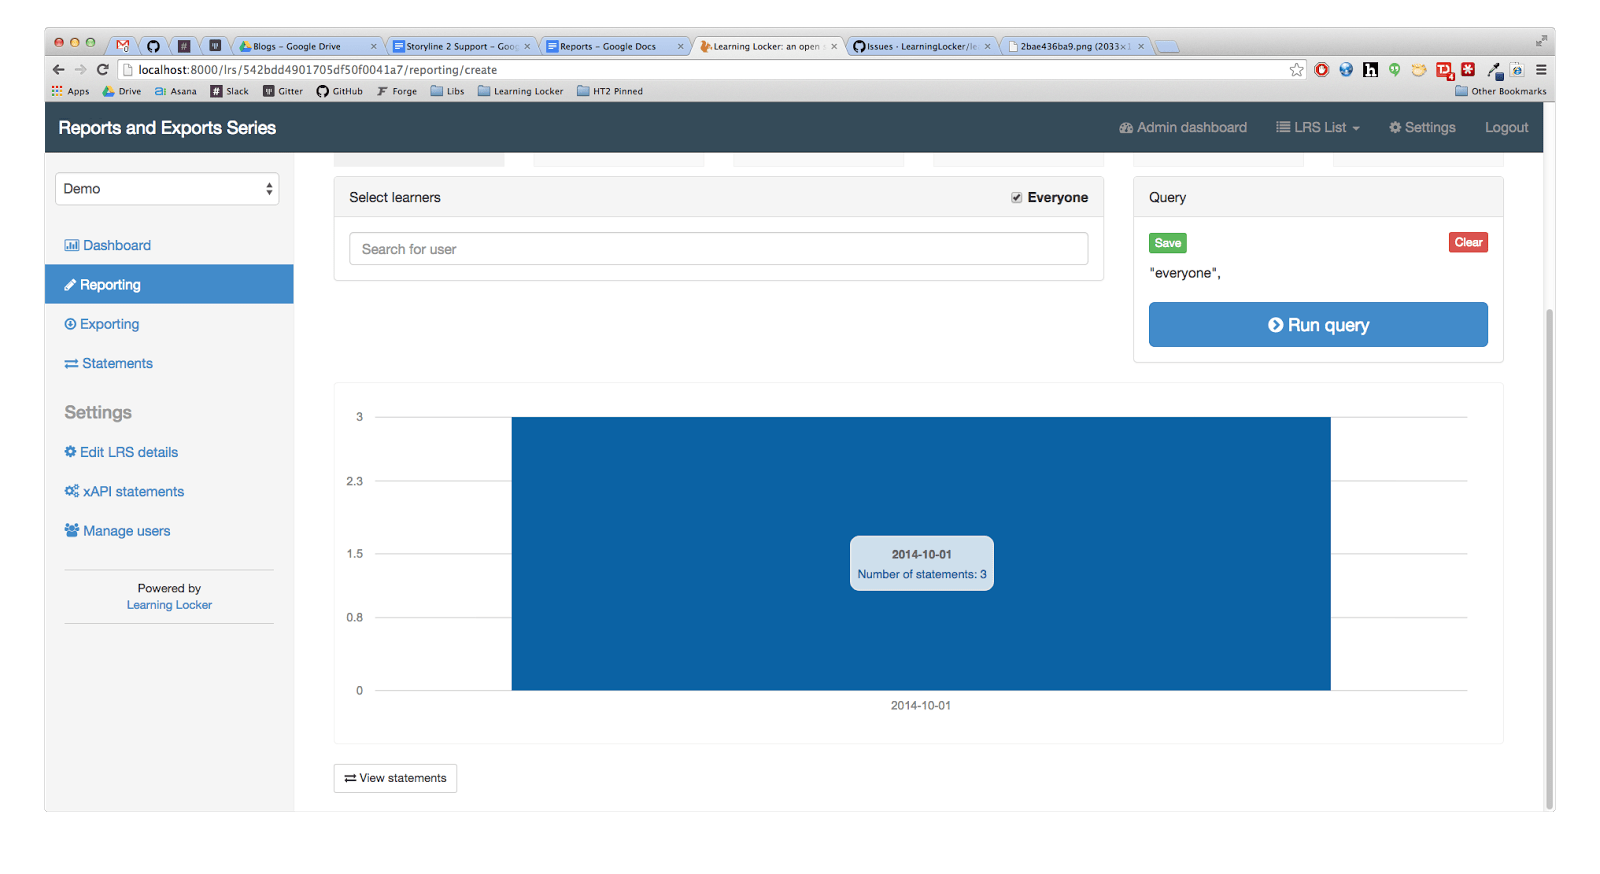
…don’t worry, you can still modify your filters if the result isn’t what you expected and click the Run query button again.
If you’re happy with this report and you’d like to be able to run it again some other time, click the green Save button and you’ll be prompted to name and describe your report like so (make sure do not click the create button again)…
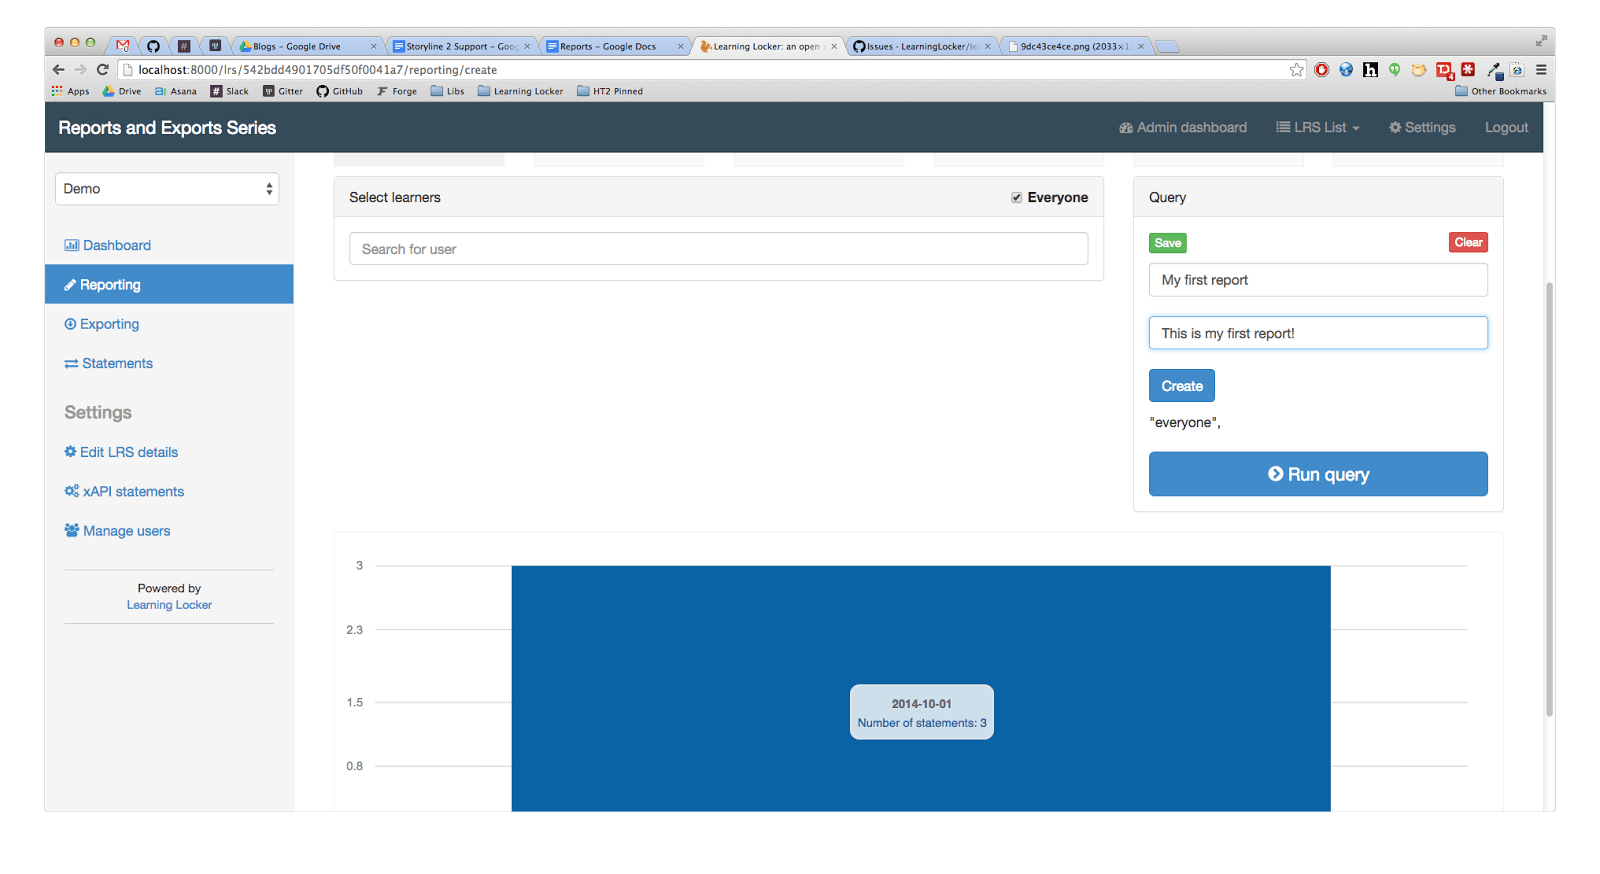
…once you’ve named and described your report, you can go back and view all of your saved reports by clicking Reporting on the left side.
If you’d like to hang around after saving your report, you might be interested to know that if you scroll down a little you can view the statements that were returned by the report by clicking the View statements button just like you can in the statements view (which can be found by clicking Statements on the left side).
Can I Get this Data in a Spreadsheet?
Yes! Yes you can and in part two of this three part series, I will show you how to use exports which allow you to do just that, and much more!
On a Final Note…
I know this is an unusually long blog post so thanks for sticking around to the end, hopefully you have found this useful and are now much wiser about reports in Learning Pool LRS. If you find any issues with our reporting tool please report them in our issue tracker on Github.
Got a learning problem to solve?
Get in touch to discover how we can help

